Integrating threat intelligence into a security operations center (SOC) investigation process can be challenging. Teams unfamiliar with incorporating threat intelligence into their systems often employ indicators of compromise as mere checklists. While this is acceptable, a wealth of additional context could prove valuable during the investigation process.
Teams utilizing Microsoft Sentinel as their Security Information and Event Management (SIEM) and Security Orchestration, Automation, and Response (SOAR) platform can use the integrated threat intelligence module. This feature simplifies the handling of indicators during investigations.
Here's a guide to using a threat intelligence module in Microsoft Sentinel, with a demonstration of its application in a typical SOC investigation scenario.
[ See Free Trial on Azure Marketplace: ReversingLabs - Early Detection of Ransomware for Sentinel | Learn More: ReversingLabs Threat Intelligence for Microsoft Sentinel ]
Investigating an incident
The basic concept of out-of-the-box analytics rules for threat intelligence in Microsoft Sentinel is to match indicators of compromise with associated field names in the specified tables. The screenshot below shows an example of a typical incident:
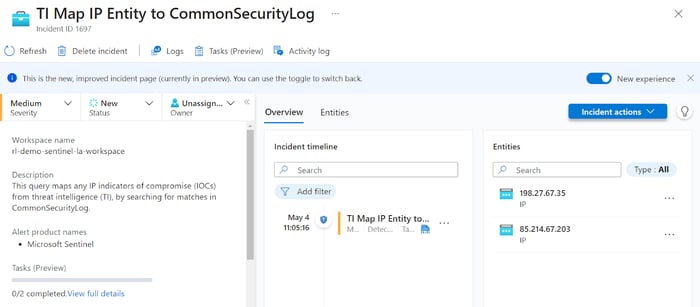
Surface details
Right from the start, there are several pieces of information to note. The incident name indicates that the analytics rule responsible for this incident matches threat intelligence indicators with data from the CommonSecurityLog table. This table collects standardized logs from a variety of sources. The first step an analyst takes is to examine the raw data to identify the specific system or application that generated the event. Clicking on the alerts in the incident timeline panel, then clicking the “Events in LA” link shows the source.
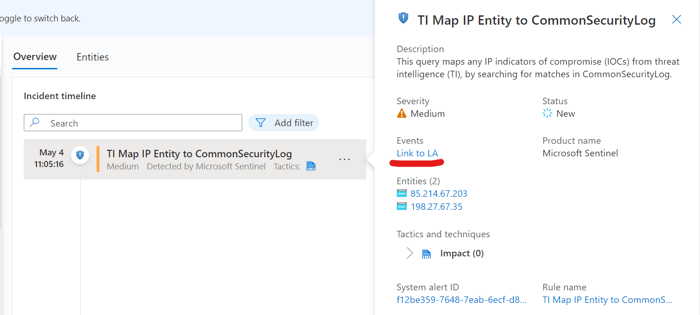
Clicking the alert in the incident timeline opens the alert details
After clicking the link, the convenient log query window appears pre-filled with the KQL query that triggered the alert. In this example, an analyst can now determine that there seems to be inbound network traffic from the IP addresses:

Viewing the raw data with the log query builder
The entities panel provides the exact threat intelligence indicators that triggered the incident. There are two IP addresses involved with this incident. Clicking on each entity opens up the entity details window.
The Info tab provides basic details about the entity. Microsoft also enriches IP addresses and domain entities through geolocation and WHOIS data. The timeline tab shows related events over the previous seven-day period. Lastly, the Insights tab contains other potentially valuable data, such as hosts that have sent traffic to the IP address.
|
NOTE: IP address geolocation is not exact, and can change often. Use this information as an additional source, but do not solely rely on it when making decisions. |
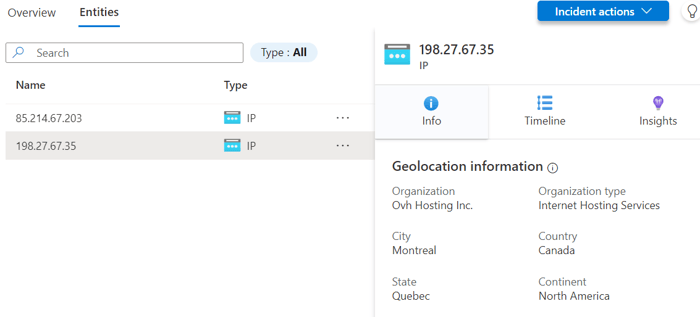
Entity details window showing enrichment information from Microsoft
From the analyst's perspective, there are a few things to note here that can help with classification decision-making:
- Organization: consumer VPS and VPN providers tend to see more abuse than traditional ISPs.
- Geolocation data: consider whether your organization expects traffic to the specified regions.
- Frequency/volume of activity: how long has this traffic been seen? Is this a regular occurrence? How many systems are involved?
Below the surface
After reviewing the primary data presented in the incident details view, it's time to examine other information that can assist the investigation.
The Microsoft Sentinel threat intelligence module can offer more details than the indicator itself if you configure the indicator feed accordingly. These details include providing confidence levels, detailed descriptions, and tags and ensuring indicators are active only when they are genuinely active. These factors can determine whether an indicator feed becomes more of a hassle than it's worth.
|
See our summary of recommendations on the value of a threat indicator feed. |
Analysts can view these details in the threat intelligence menu, or they can stay in the incident details view and use the log analytics window to run a query. For this example, the indicator type uses the NetworkIP column. It is recommended to retrieve the latest data for the indicator with arg_max() (replace <IP_ADDRESS> with the IP in question):
ThreatIntelligenceIndicator

| summarize arg_max(TimeGenerated, *) by NetworkIP

| where NetworkIP == <IP_ADDRESS>
This particular indicator was found in the ReversingLabs ransomware indicators feed. It's important to note that the format of additional data may vary in other indicator feeds. The findings suggest that a malware-infected file has interacted with this specific IP address. Further, the provided tags reveal that this IP address has been involved in a Qakbot campaign. It is also classified as being in the 'early' phase of a ransomware attack.
Having identified a specific type of malware, the immediate next course of action is to inspect the environment for additional indications of a Qakbot infection. Qakbot ranks among the most common malware types today, and thankfully, there's a high level of vigilance toward its methods and strategies for breaching systems. The MITRE ATT&CK framework is highly valuable for understanding well-known malware types and threat actor groups, including Qakbot, referenced as Software S0650.
Analysts can utilize the Microsoft Sentinel Hunting menu to quickly check for indicators of the tactics and techniques identified for the malware family. For example, Qakbot has been known to use T1047 - Windows Management Instrumentation to gather information about systems.
If you have the "Windows Security Events" hub solution installed, filtering on this technique provides an included hunt query:
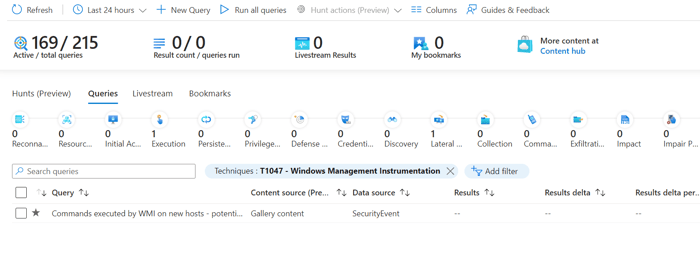 Filtering Microsoft Sentinel Hunt queries by MITRE ATT&CK technique
Using the above methods for utilizing threat intelligence indicators during an incident investigation can give a SOC analyst more context about the incident, and verify if a wider incident is in progress.
Conclusion
This blog post covered some techniques for SOC analysts to approach a threat intelligence-related security incident in Microsoft Sentinel. To summarize the general workflow:
-
Analyze surface-level details of the incident to understand what happened and what entities are involved.
-
Check indicator details in the Microsoft Sentinel threat intelligence module to identify the specific threat actor, techniques, etc.
-
Spot-check the environment for techniques used by the threat actor to ensure there isn't a widespread infection.
This blog post details various methods that SOC analysts can utilize when dealing with threat intelligence-related security incidents using Microsoft Sentinel. Here's a simplified breakdown of the overall process:
- Scrutinize the details of the incident. This step helps you comprehend the nature of the incident and identify the entities involved.
- Refer to the threat intelligence module in Microsoft Sentinel. Here, you can inspect indicator details to pinpoint the exact threat actor and the techniques they've employed.
- Conduct random checks across your environment for any techniques the identified threat actor might have used. This step ensures that there isn't a more extensive infection than initially observed.
Looking to get started with threat intelligence in Microsoft Sentinel? Get ReversingLabs' ransomware indicators feed with a 30-day free trial, available in the Azure marketplace.
Explore RL's Spectra suite: Spectra Assure for software supply chain security, Spectra Detect for scalable file analysis, Spectra Analyze for malware analysis and threat hunting, and Spectra Intelligence for reputation data and intelligence.


